How to Study Statistics: A Beginner’s Roadmap
Numbers make sense. Statistics still feels like a different language. Sound familiar?
You are not alone. Statistics scares more students than almost any other subject. The fear is common. The fix is simpler than it looks.
This roadmap shows exactly how to study statistics from the very start. It builds real understanding, not just memorized formulas.
Why Statistics Feels Harder Than It Actually Is
Statistics mixes maths with real world thinking. This combination confuses students used to clear right or wrong answers.
Many students also carry old fears from maths class into statistics. That fear builds up before the subject even starts.
The Real Research Behind Statistics Anxiety
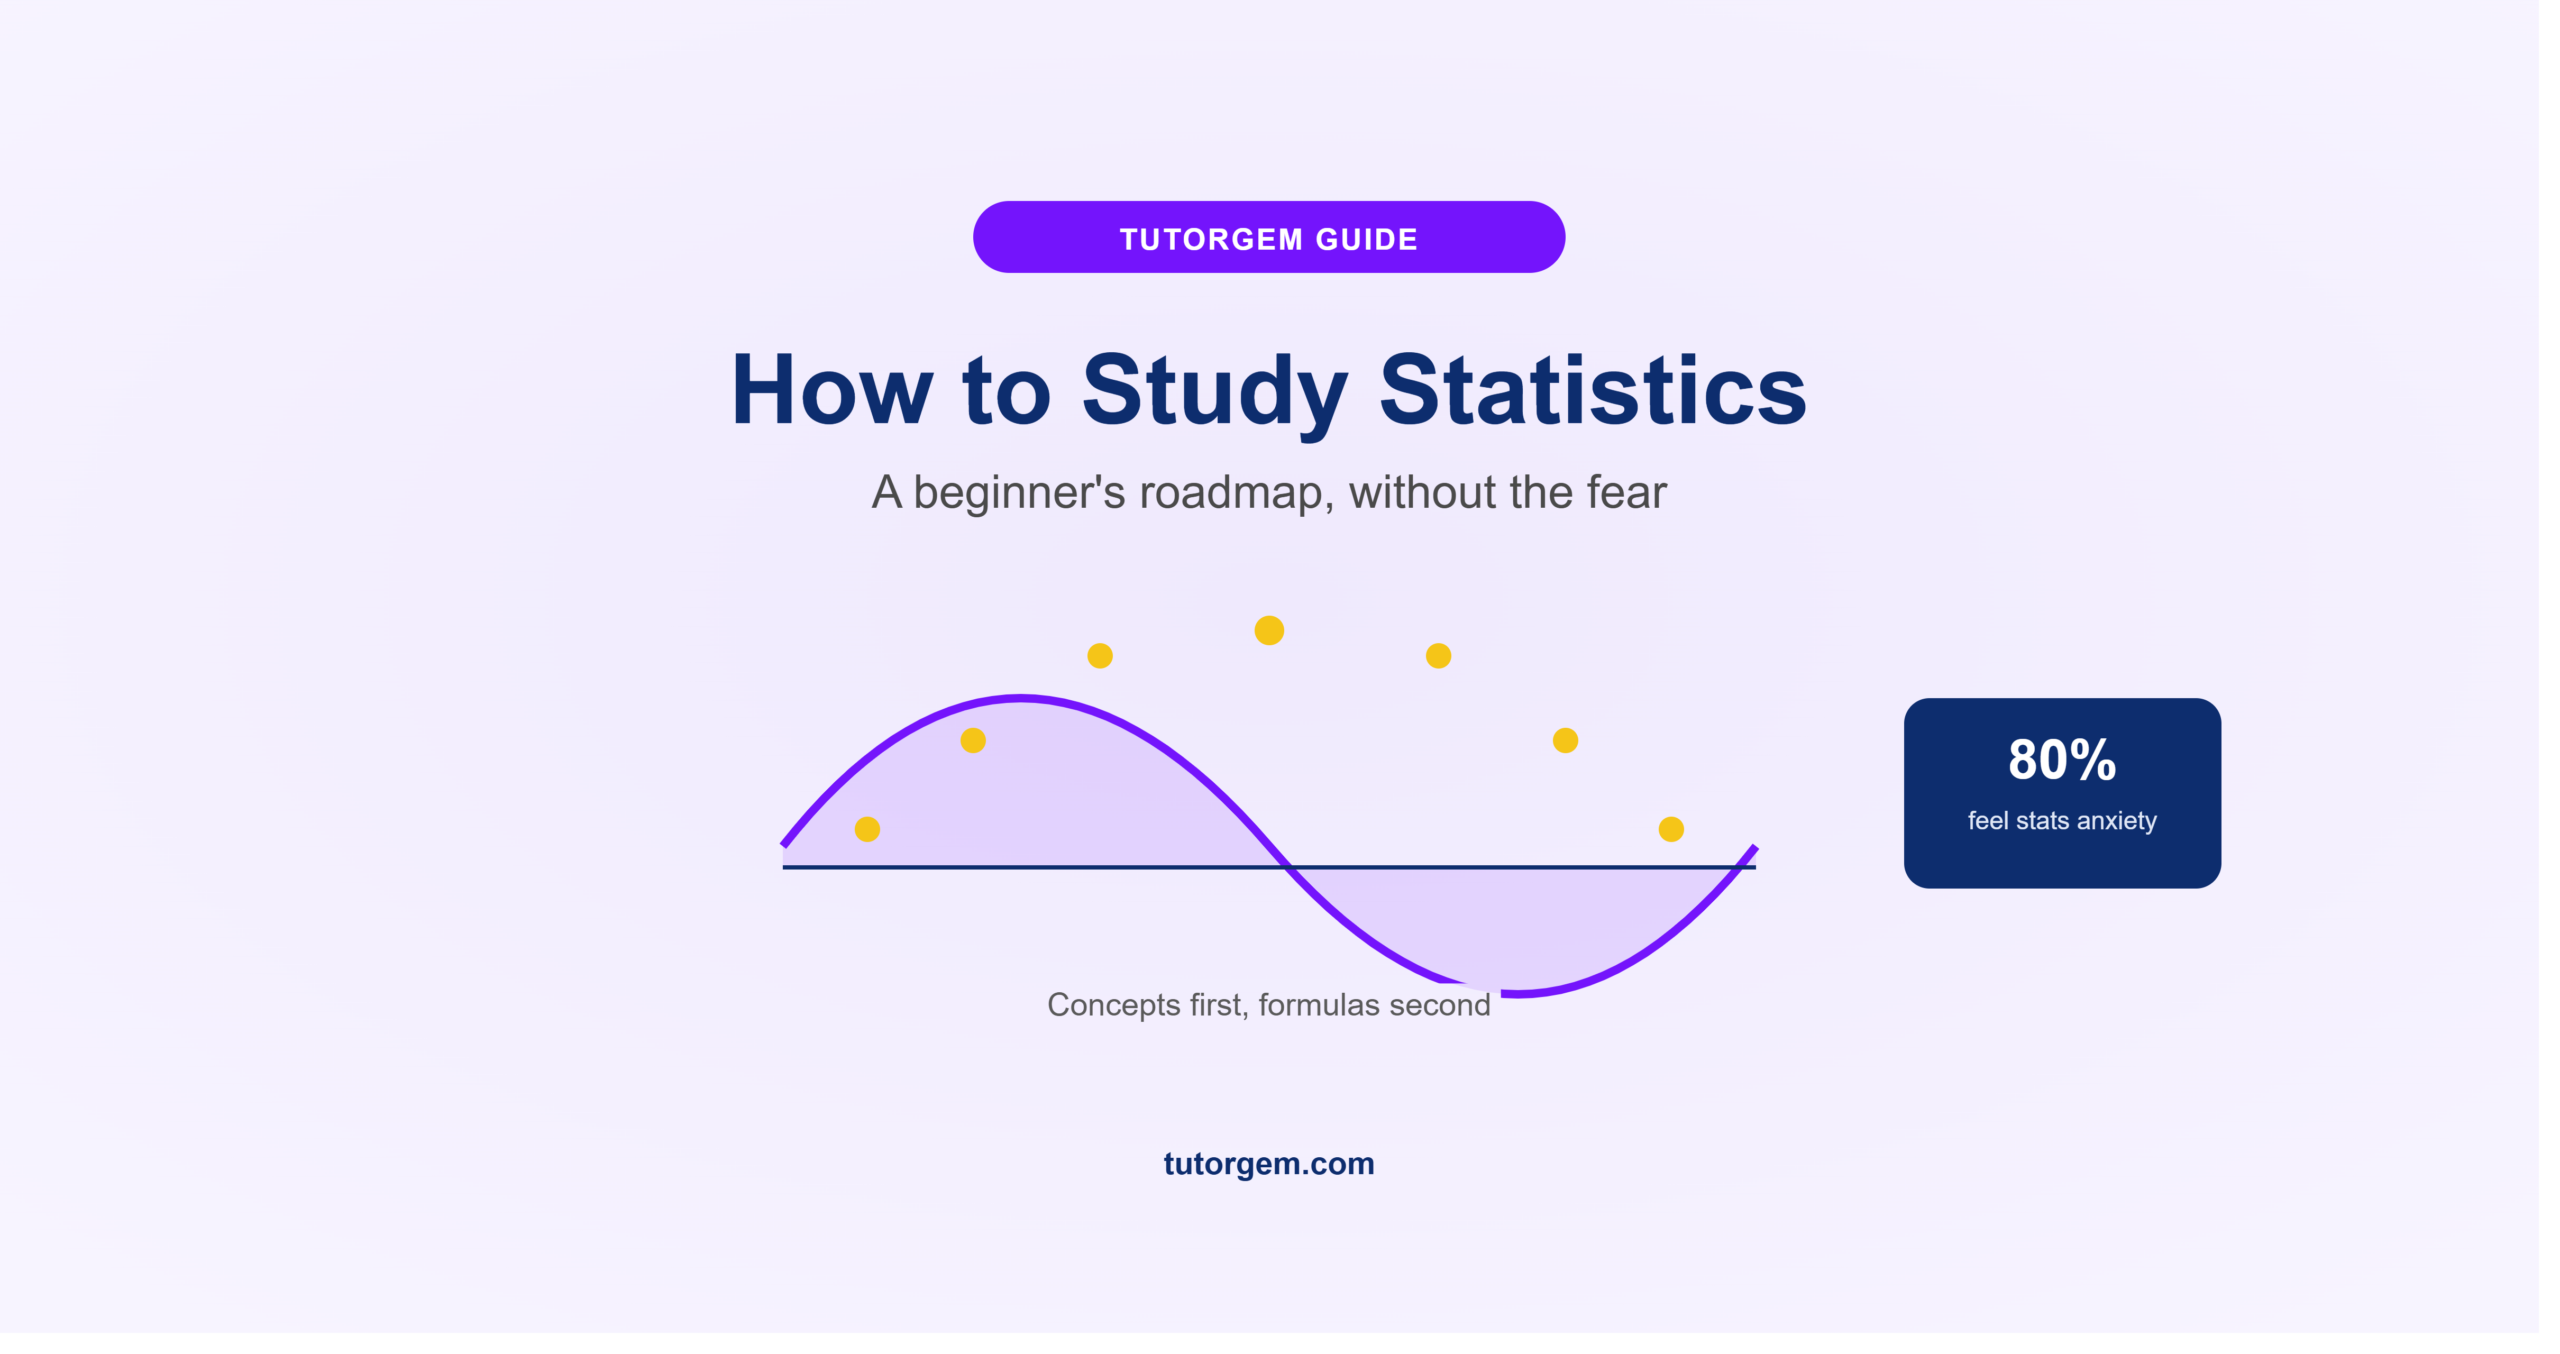
Research shows that up to 80 percent of college students experience some form of statistics anxiety. This fear often has little to do with actual ability. It comes from past experiences and negative beliefs about the subject.
This number matters. It shows that struggling with statistics is normal, not a sign of weak maths skills. Knowing this helps remove the fear before real study even begins.
How to Study Statistics the Right Way
Most students start in the wrong place. They memorize formulas before understanding what those formulas actually measure.
Start With Concepts, Not Formulas
Learn what a concept means in plain language first. What does average really tell you. What does standard deviation actually measure. Formulas make sense once the concept is clear.
Students who skip this step often memorize steps without understanding why those steps work. This creates confusion the moment a question looks slightly different from the example.
Build Data Intuition Before Memorizing Tests
Look at real data before diving into formal tests. Ask simple questions first. Does this data look spread out or close together. Does one number look unusual compared to the rest.
This habit builds intuition. Intuition makes the formal tests, like t-tests or chi-square tests, feel like tools instead of mysteries.
The Core Topics Every Beginner Must Master
Every statistics course builds on the same small set of core ideas. Master these first before moving to anything advanced.
| Topic | What It Measures | Common Beginner Mistake |
|---|---|---|
| Mean, median, mode | Central tendency of data | Confusing which measure fits skewed data |
| Standard deviation | Spread of data | Forgetting what a large value actually means |
| Probability | Chance of an event | Mixing up independent and dependent events |
| Correlation | Relationship between variables | Assuming correlation proves cause |
| Hypothesis testing | Testing a claim against data | Misreading what a p-value actually shows |
Probability Basics First
Probability underpins almost every other statistics topic. A shaky grasp of probability makes later topics, like hypothesis testing, far harder to follow.
Practicing simple probability problems, like coin flips or dice rolls, builds the foundation every advanced topic depends on later.
A Real Case: From Fear to Confidence
One TutorGem student avoided her statistics module for months, convinced she was simply bad at the subject. Her real problem was different. She had jumped straight into formulas without ever building basic data intuition.
Her tutor rebuilt her foundation from the concept level up, starting with simple real world data before touching any formal tests. Within four weeks, she could explain concepts in her own words, not just recite steps.
Her final exam mark rose from a struggling pass to a strong grade. She later said the biggest shift was realizing statistics was not actually about memorizing formulas at all.
A Simple Weekly Study Plan for Statistics
Spend the first week on core vocabulary alone. Words like variance, distribution, and significance need to feel familiar before moving forward.
Questions to Ask Yourself Each Week
Ask if you can explain this week’s topic in plain words to someone else. Ask if you understand why a method works, not just how to run it. These two checks catch gaps before they pile up.
How a Tutor Makes Statistics Click Faster
A tutor spots exactly where understanding breaks down. This turns weeks of confused self study into a clear, guided path.
TutorGem’s maths tutoring programmes include dedicated statistics support built around real data and clear, step by step explanations. This helps students move from memorized formulas to genuine understanding much faster than studying alone.
Frequently Asked Questions
Is statistics harder than regular maths?
Statistics demands a different kind of thinking than algebra or calculus, focused on interpreting data rather than solving fixed equations, which is why many students find the switch confusing at first.
How long does it take to feel confident in statistics?
Most beginners build real confidence within four to six weeks of consistent, concept first study, rather than jumping straight into formulas.
What is the best way to start learning statistics?
Start with core vocabulary and simple real world data before touching formal tests. Understanding what a concept measures makes the maths behind it much easier to follow.
Why do so many students feel anxious about statistics?
Research shows this anxiety often comes from past negative experiences with maths, not actual ability, which is why a fresh, concept based approach helps so much.
Can a tutor really make statistics easier to understand?
Yes. A tutor identifies exactly where understanding breaks down and rebuilds from that exact point, which is far faster than working through confusion alone.
Learning how to study statistics the right way turns a feared subject into a manageable one. If formulas still feel like a foreign language, a clearer, concept first approach might be exactly what closes that gap. TutorGem’s experienced maths tutors can review your current understanding this week and build a plan that actually makes sense.